|
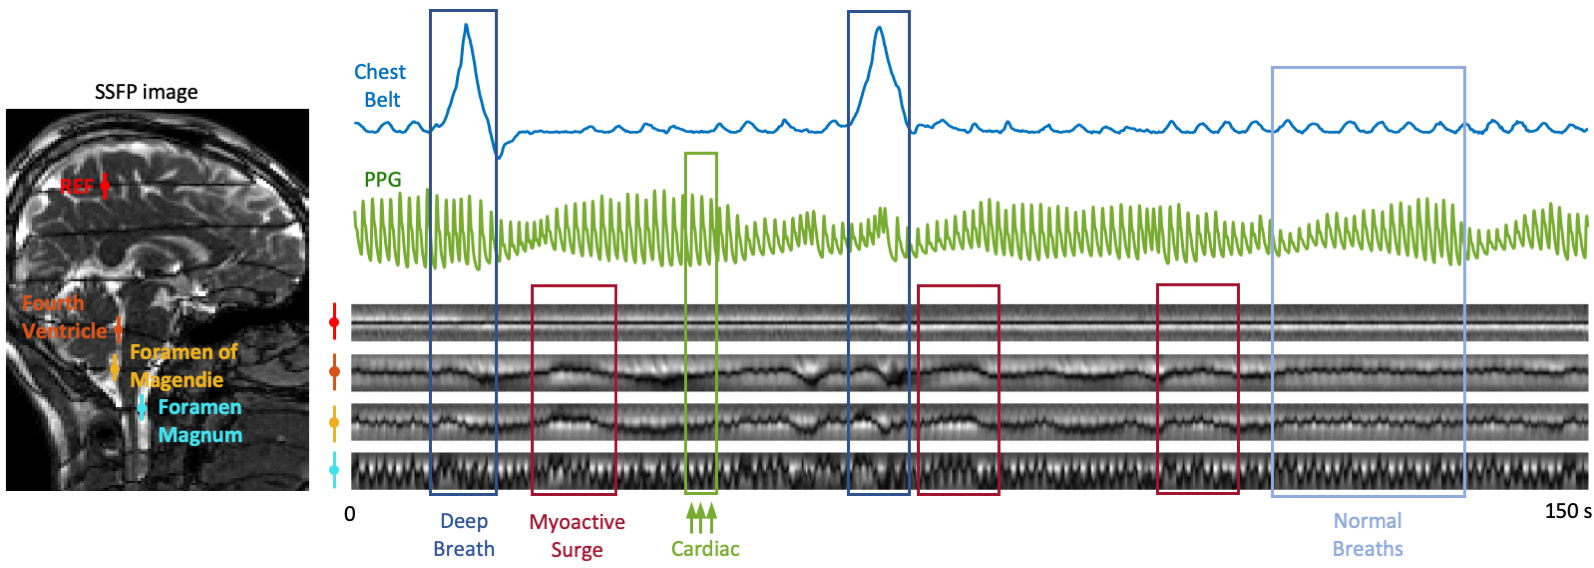
Cerebrospinal fluid (CSF) flow dynamics visualized in real time on Steady State Free Presession (SSFP) images,
with dark tags created by a background magnetic field gradient in the head-foot direction. Time plots of the tags
at a reference parenchyma location and three CSF locations are shown. Tag movements are indicative of CSF flow by
various physiological mechanisms, including cardiac and respiratory pulsations, as well as a "myoactive surge"
to the cranium. The low-frequency myoactive surge typically happens after a deep inspiration with a 11 s time delay,
consistent with a cerebral autoregulation mechanism involving CO2 effect and sympathetic activation.
|
|
 |
| |
|
|
|
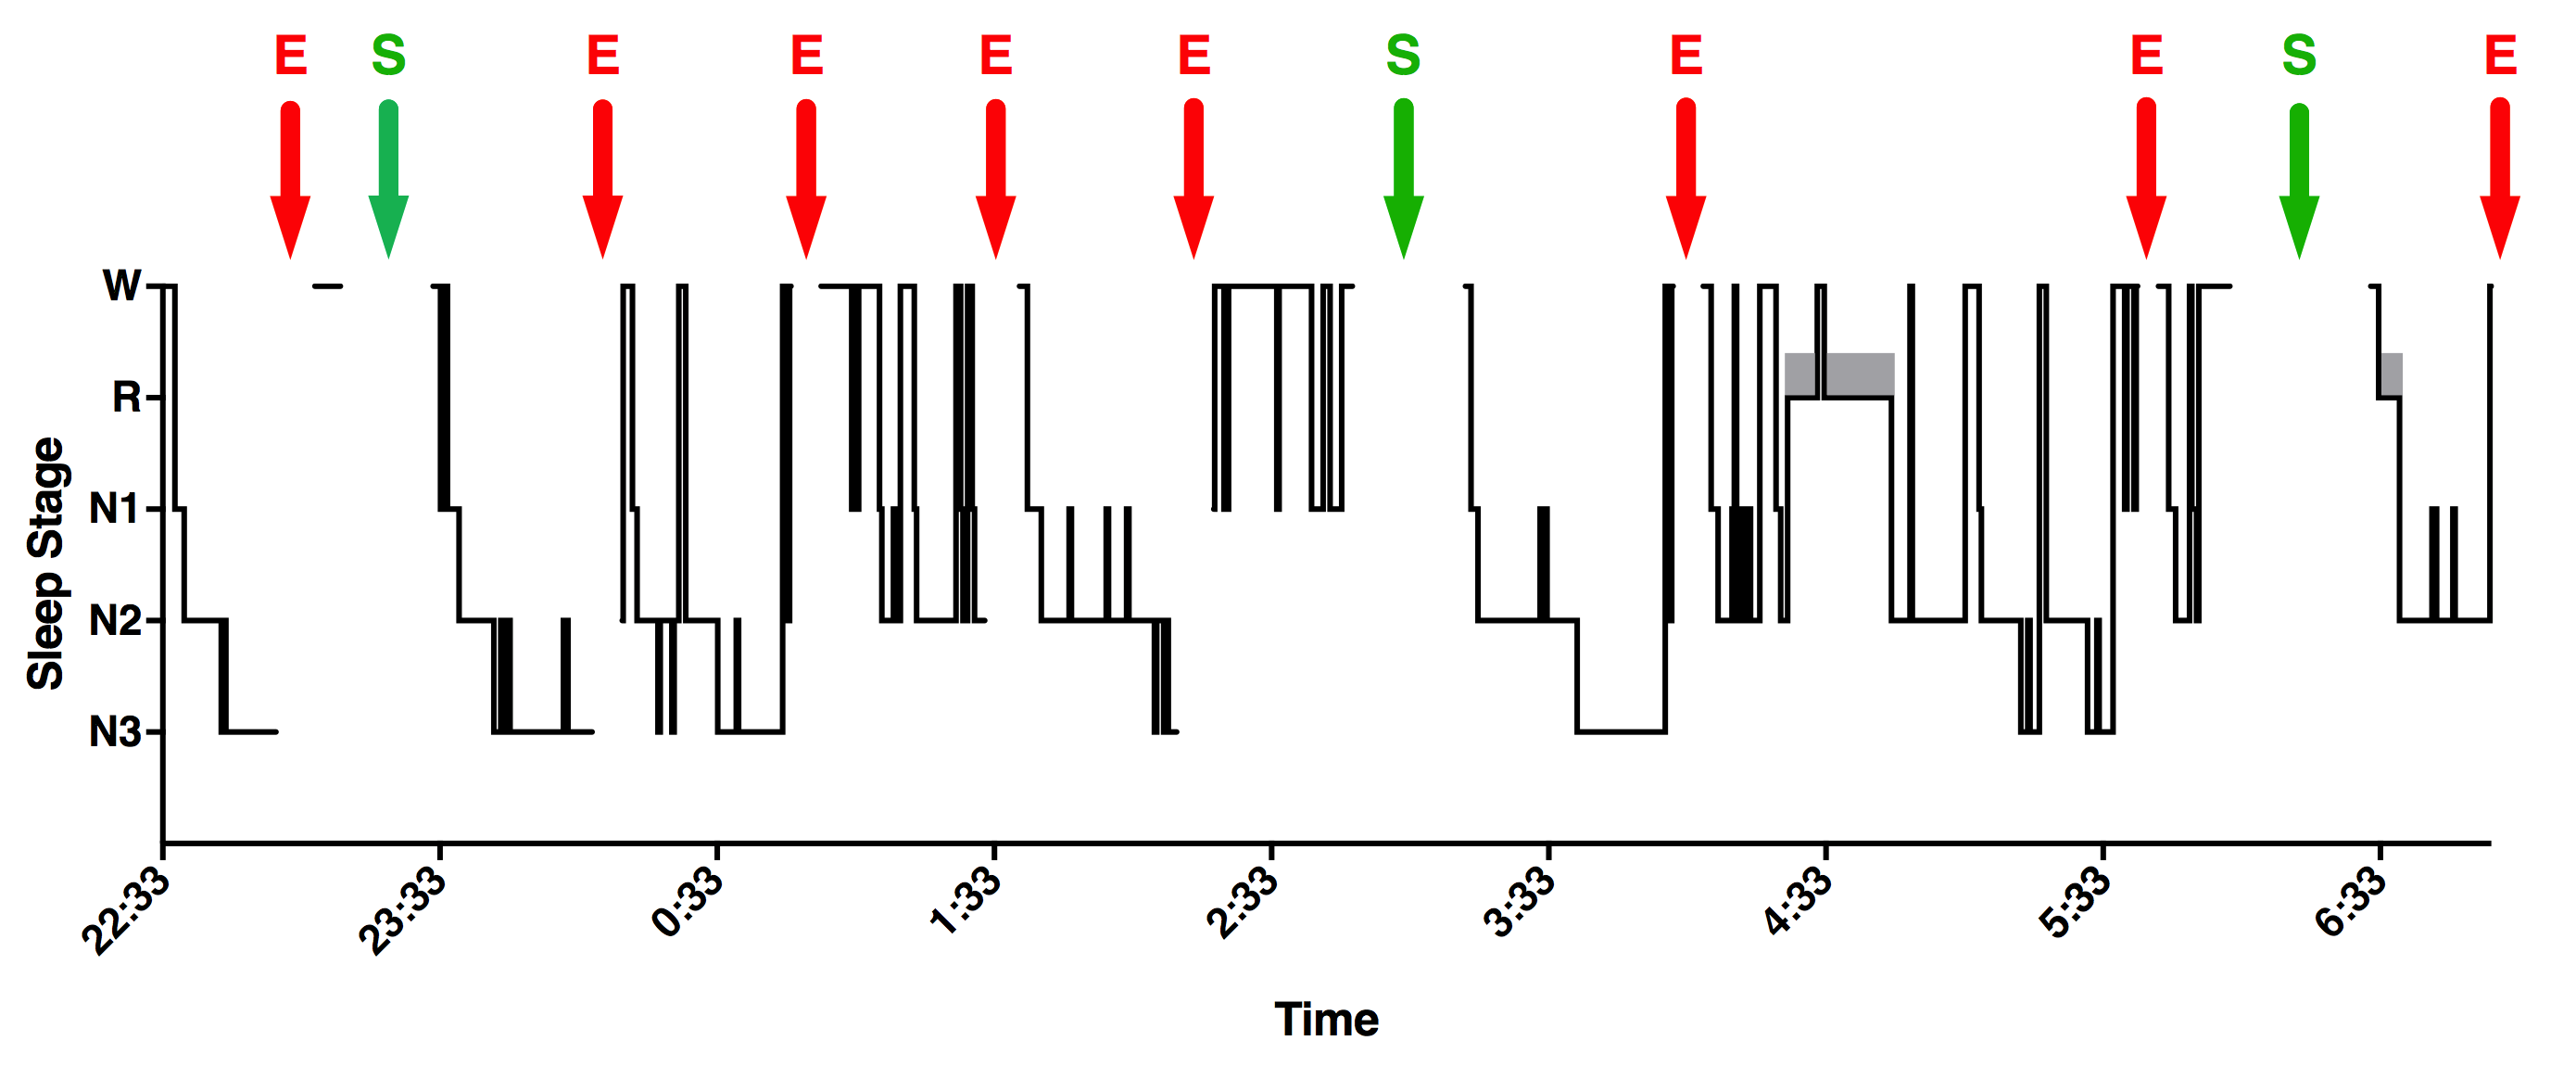
Representative hypnogram for one subject from night 2 of an all-night EEG-fMRI sleep study.
Scoring was only performed during simultaneous EEG-fMRI acquisition. No instances of unscorable
data occurred in this subject. Arrows indicate experimenter (E) or subject (S)-request arousals
(Moehlman et al., 2019)
|
|
 |
| |
|
|
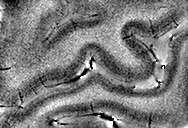
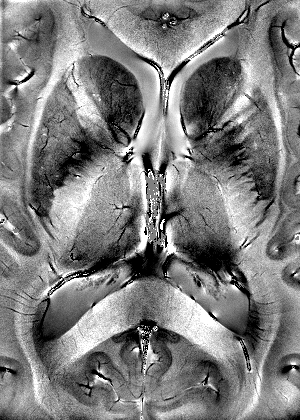
| gradient echo phase image of central sulcus, 220x220x1000 micron,
scan time 12 minutes |
|
 |
| |
|
|
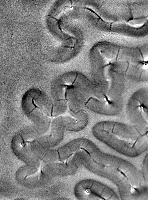
| gradient echo phase image, 220x220x1000 micron, scan time 12 minutes |
|
 |
| |
|
|
| gradient echo phase image, 220x220x1000 micron, scan time 12 minutes |
|
 |
| |
|
|
| gradient echo phase image, 220x220x1000 micron, scan time 12 minutes |
|
 |
| |
|
|
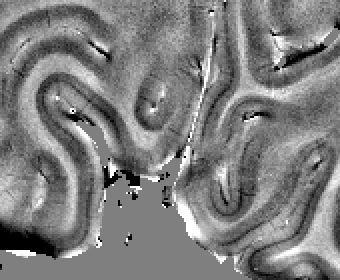
| gradient echo phase image of occipital lobe, 220x220x1000 micron, scan time 12 minutes |
|
 |
| |
|
|
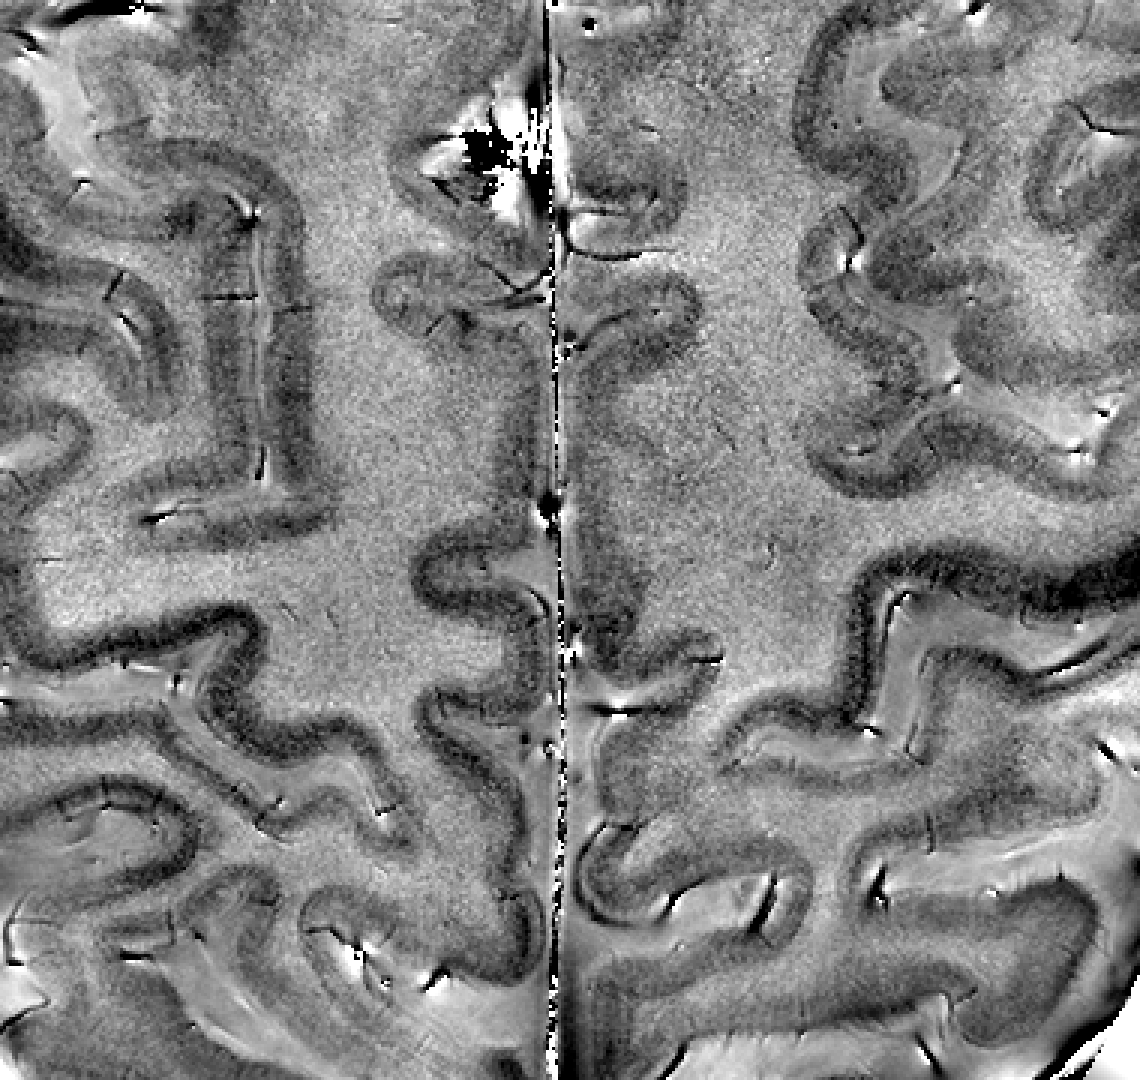
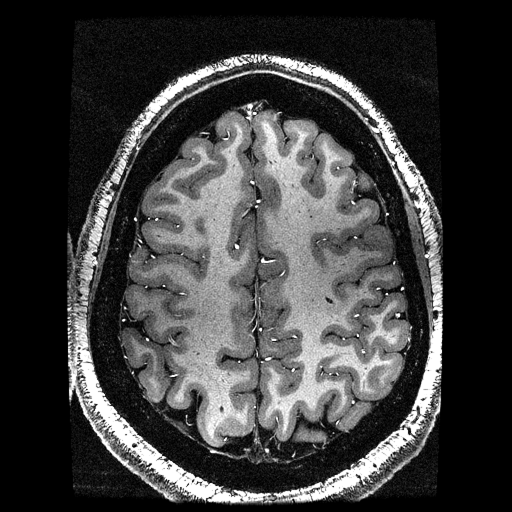
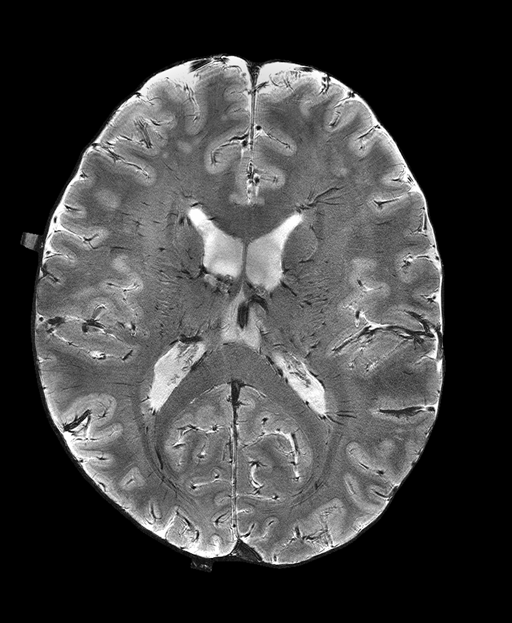
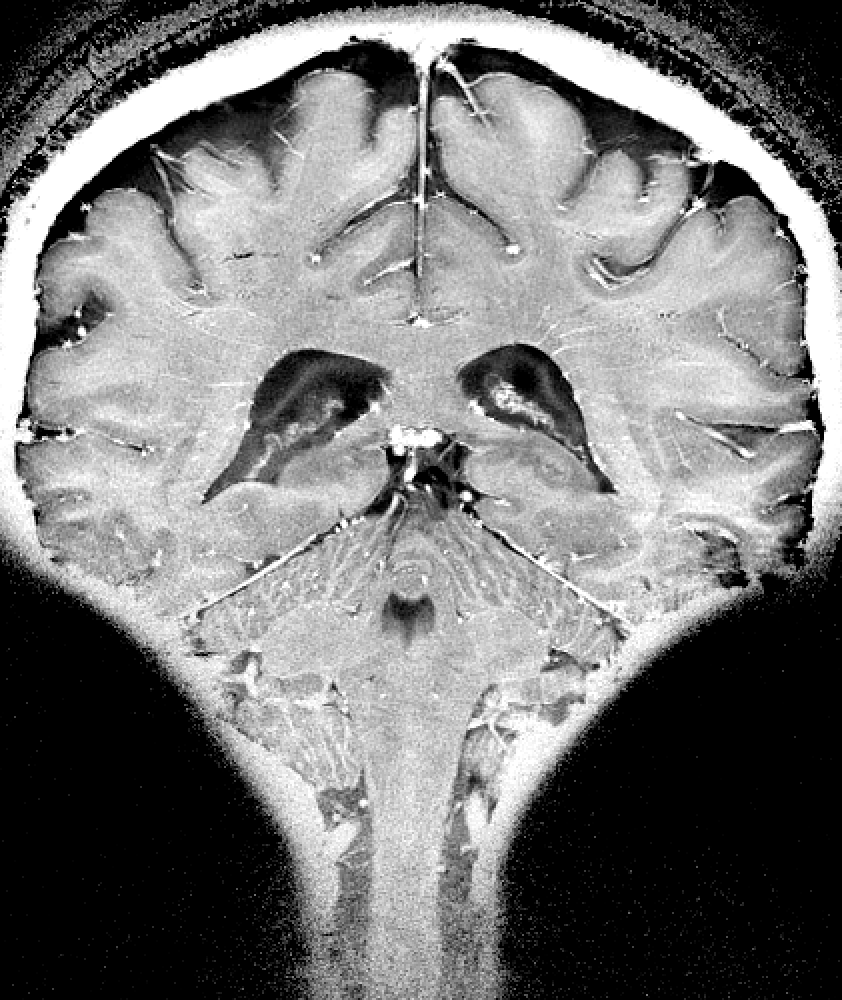
| T1-weighted in-vivo brain scan at 7 T, 8-channel brain array
resolution 400x400x1000 micrometer, measurement time 8 minutes |
|
 |
| |
|
|
| Perfusion-weighted in-vivo brain scan at 7 T, 8-channel
brain array resolution 1500x1500x2000 micrometer, measurement time 5 minutes |
|
 |
| |
|
|
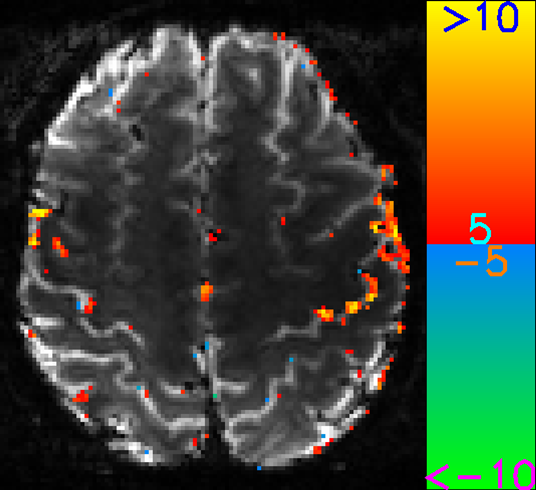
| BOLD fMRI of motor cortex at 7 T, 8-channel brain
array resolution 1250x1250x1000 micrometer, measurement time 5 minutes |
|
 |
| |
|
|
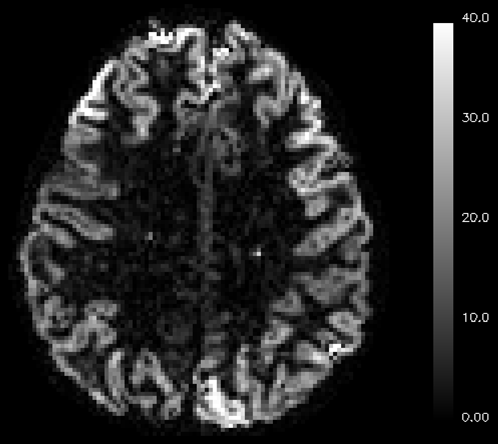
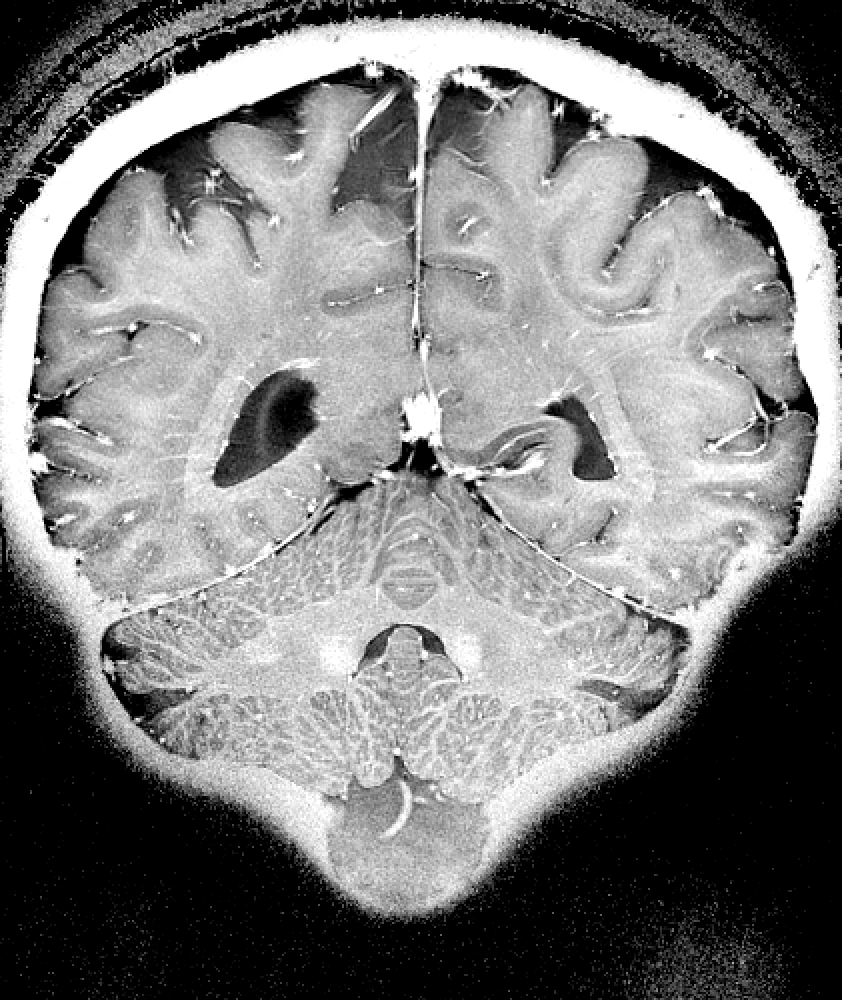
| T2*-weighted in-vivo brain scan at 7 T, 20-channel brain
array resolution 200x200x1000 micrometer, measurement time 5 minutes |
|
 |
| |
|
|
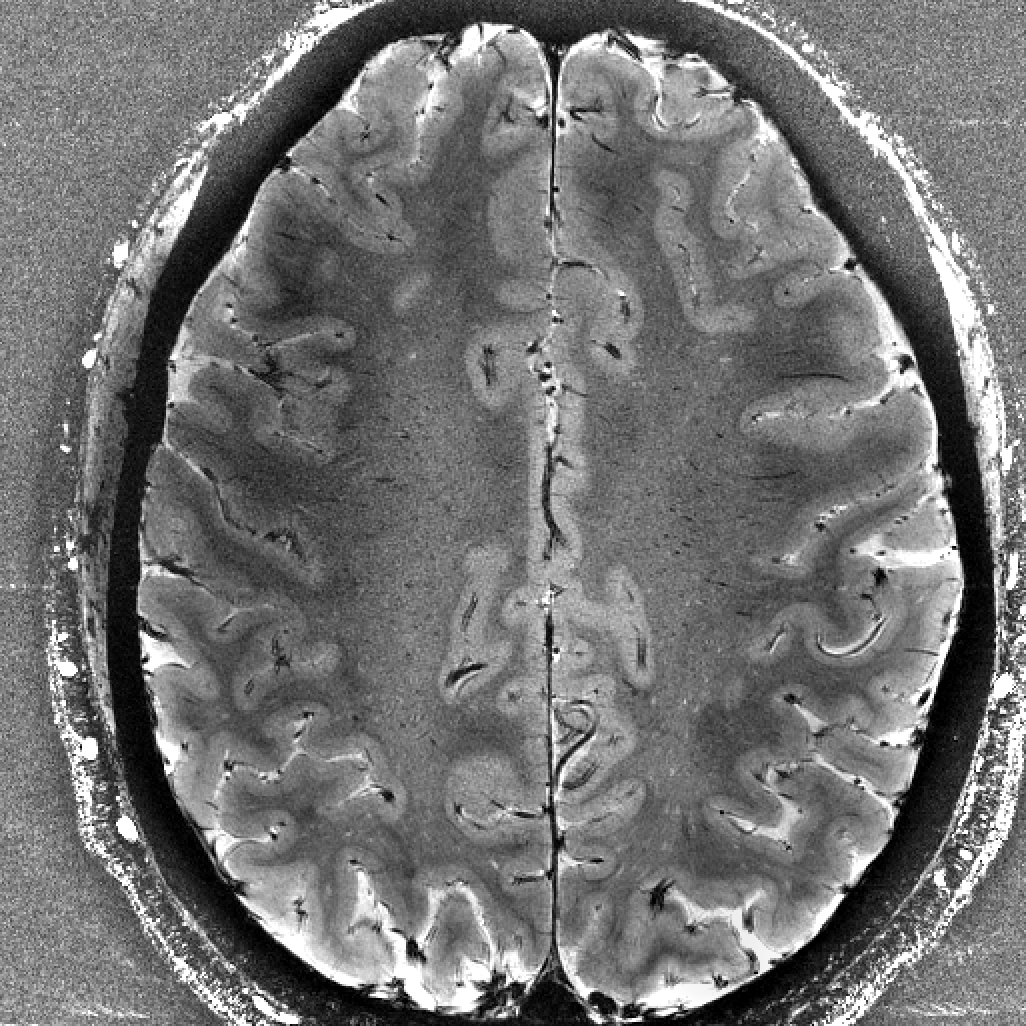
| T2*-weighted in-vivo brain scan at 7 T, 20-channel brain
array resolution 300x300x1000 micrometer, measurement time 6 minutes |
|
 |
| |
|
|
| T2*-weighted in-vivo brain scan at 7 T, 20-channel brain
array resolution 300x300x1000 micrometer, measurement time 6 minutes |
|
 |
| |
|
|
| T2*-weighted in-vivo brain scan at 7 T, 20-channel brain
array resolution 300x300x1000 micrometer, measurement time 6 minutes |
|
 |